
In a world where opportunities are limited, who do you think is more likely to get promoted and get a raise? And who is more likely to be shown the door?Excel might just be a skill, but if you don’t take it seriously, it could quickly turn into a ticking time bomb.
Why Being Good at Excel Feels AwesomeAdvantage 1: You process and analyze data faster than others, and you get to leave work earlier.In many companies, every department needs to summarize and report daily updates. Most employees manually work through the data, but those who know how to use the following dashboard techniques can finish in a few hours what takes others a full day.
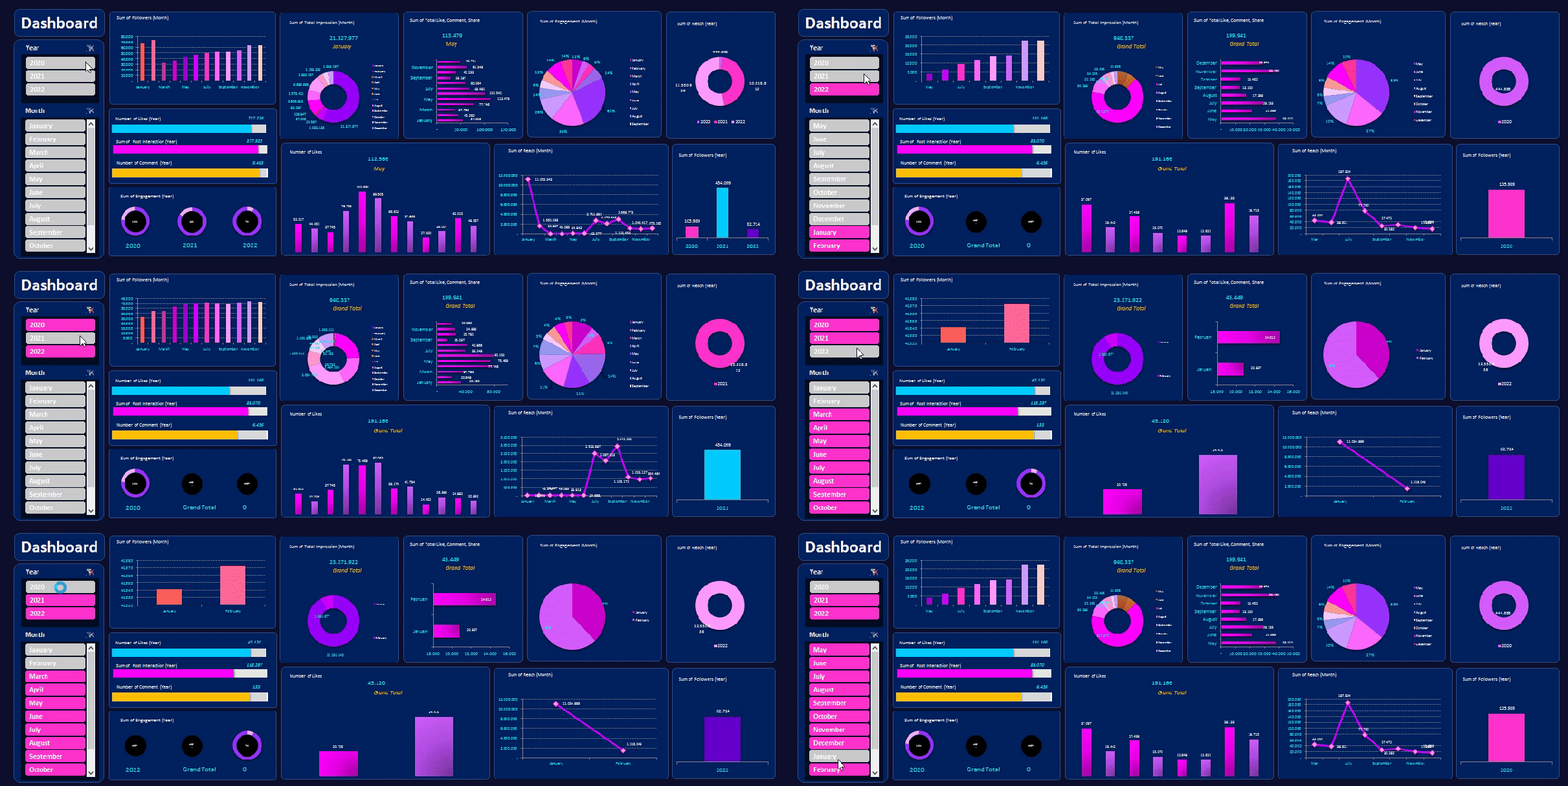
Advantage 2: Interactive reports make presentations clear and engaging.When it’s time to present a project report, your boss asks for a breakdown of each project’s revenue and expenses. Others hand in lengthy, boring spreadsheets, but you present something like this — a dynamic, automated report where you can click to view the relevant stats. Which do you think your boss would prefer?
Definitely yours! It’s an interactive report that clearly shows the relationships and differences between the data points, with the key points standing out, making decision-making easier.
Advantage 3: When vying for resources or expressing opinions, you’re more persuasive.When others present their ideas to the boss, it’s all “I think we should do this…” or “I believe we should do that…” Most of the time, bosses feel skeptical…
But those who have a data-driven mindset can show historical data alongside current figures, pointing out reasons 1, 2, and 3, and then propose solutions based on these insights. Let the data speak for you! A data-driven approach and data operations highlight the key points.
If you were the boss, wouldn’t you be convinced by a subordinate who presents their ideas backed by solid data?
To bosses, someone who has strong logic is the person who can use Excel to quickly, accurately, and beautifully organize data.To bosses, someone reliable is the person who can use Excel to create charts that clearly present results at a glance.To bosses, someone irreplaceable is the person who can use Excel to analyze and extract valuable insights from data.
However, reaching this level of proficiency takes time and consistent learning. So, is there a way to quickly get started? Absolutely! VeryCareer’s Co-founder @William Ziegler has designed a comprehensive Excel course for everyone: “36-day Excel Boot Camp: From Beginner to Advanced with William Ziegler!”
This is a comprehensive series of courses, featuring a 3-day trial class called “3-Day Excel Jumpstart: Unleash Your Excel Power!”
In this 3-day trial, you’ll experience the Workplace Essentials: Beat inefficiency with 3 core skills, transforming two weeks’ worth of work into just 30 minutes.
Once purchased, you can rewatch the lessons as many times as you want without worrying about expiration. This course has undergone over 20 iterations just for the syllabus alone, with the content refined for over a year.
VeryCareer and William spent a year developing an entirely new teaching approach that offers:
1. One-click solutions to handle repetitive manual tasks.A lot of people use Excel for manual calculations, but many are still stuck typing formulas like =A1+A2+A3+… directly into cells.If the dataset is large, manual entry could take longer than using a calculator!William will show you a faster way:Select the range, press Alt + = on the keyboard, and Excel will sum all the data instantly—quicker than using a formula!
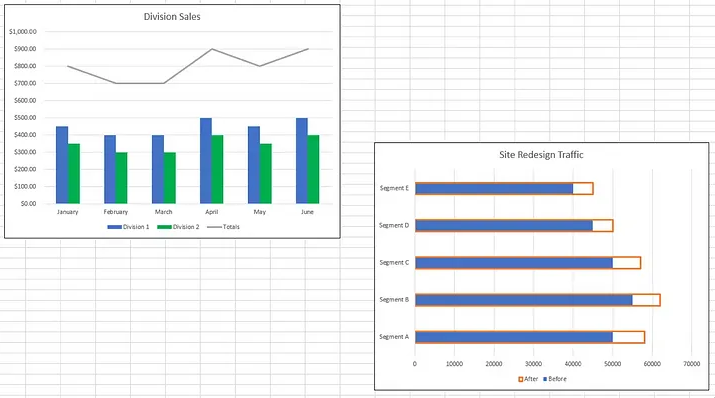
2. Chart creation that speaks volumes.A picture is worth a thousand words, and clear, insightful charts are a powerful tool in any report.However, most people don’t understand the fundamentals of chart creation. William will teach you how to create these polished, professional charts that make an impact.
3. Real-world case studies to build data analysis thinking.For example, in financial management, financial modeling, or financial report analysis, William will show you how to use modeling and report analysis to uncover the real issues behind the data.After reading these examples, you’re probably curious about what kind of course this is, right?
This time, we’ve invited William to share the essence of his 15 years of Excel expertise with you. This course isn’t just about basic data statistics; it’s about improving data processing efficiency, mastering the art of chart aesthetics, developing data-driven thinking, enhancing logic, and improving reporting skills.
Even if you’re an Excel beginner, you can start from scratch and learn alongside William.
If you’re interested, visit the link below to sign up for the 3-day Excel trial camp — you’ll be amazed at how it changes your perspective!
Once purchased, you can rewatch the lessons as many times as you want without worrying about expiration. This course has undergone over 20 iterations just for the syllabus alone, with the content refined for over a year.

